
The Tableau vs Power BI debate is largely a waste of time
The choice of business intelligence tool probably doesn't matter as much as you might think it does

Nothing makes me groan more than data professionals asking whether I prefer Tableau or Power BI.
The debate over which of these popular BI tools reigns supreme still rages in many corners of the business intelligence and data visualisation communities. A quick scroll through the relevant subreddits is all it takes to see how alive (and how pointless) these disputes remain. For two mature, widely used tools, the level of tribalism is oddly persistent.
Recently, someone asked me this question out of the blue. My faced scrunched up like I was sucking on a lemon.

“I dunno, man, whatever works for you”
For the uninitiated, Power BI and Tableau are the dominant platforms for modern day business intelligence. They both offer the ability to communicate information in visually consumable formats, often consumed in the form of the ‘dashboard’.
Both more or less have the same functionality and grant the ability to model data in a usable form, though there are differences in the way they do this, along with how data can be visualised. But at their core, they’re essentially filling the same market niche.
My own career has definitely leaned Tableau (after all, I’m a three-time Tableau Ambassador), and that’s why a few years back, if anyone asked me what which I thought was better, I would have responded with near-religious conviction, “Tableau, of course”. After all, that’s all I knew, how could I recommend anything else?
But later, I worked at an organisation that was purely PowerBi. And it was fine.
Nowadays, I’m older, grouchier, but possibly a little wiser. And now I would answer that question different:
“I don’t care”.
I don’t think I have some super special insight or anything, I’m just beyond the whole the debate. Now, I usually just trying to find the fastest exit from any discussion around PowerBI v Tableau, because I consider it a pointless argument.
I do want to mention: this isn’t a critique of Tableau or Power BI. Both are excellent tools. It’s a critique of the energy we waste arguing about them.
With that in mind, I thought it might be interesting to touch on why I think it’s pretty pointless. I’ve got three points to make as to why I think such discussions are now largely unproductive. So, let me indulge.
It’s not what the tool can do for you, it’s what you can do with the tool
You’ll get far more value from whichever platform you’ve learned to use well, not the one with the flashier interface or more belligerent fans.
Most users barely scratch the surface of either Tableau or Power BI. But in the hands of a skilled analyst, both tools are more than capable of delivering fast, insightful, and beautifully designed dashboards. In the wrong hands, either one can produce confusing, cluttered, and ineffective outputs.
So instead of worrying about which tool is “better,” invest your time in mastering the one you have access to. Learn its quirks. Explore its depth. Push it beyond the defaults. That’s where the real value lies.
And yes, the fundamentals of visual design matter too, but we’ll get to that in point three.
Of course – you could just hedge all your bets and master both PowerBI and Tableau, which isn’t out of the question and actually not that difficult to achieve if you’ve got any sort of experience in the field.
So now, when someone asks me, “Which is better?”
My honest answer is: “Whichever one you’ve used enough to master.”
Mastery beats preference every time. And if you’re really looking for enlightenment, learn both, then you’re not stuck in tribal debates. You’re just getting work done.
You probably don’t get to choose anyway
In an organisational setting, BI tool selection is often made far above most data professionals’ pay grade and for reasons that have little to do with dashboard UX or capability.
In most medium to large organisations, the choice between Tableau and Power BI can often be made by IT, finance, or procurement teams. If you’re lucky, they’ll consult the data and analytics team, but in my experience, I’ve found that’s usually not the case.
Organisation criteria are less about which tool renders charts better and more about things like:
Licensing costs
Integration with existing systems
Vendor relationships or support contracts
Minimisation of risk
That’s why arguing about tools can feel like debating over which is better: Toyota or Honda. Sure, you may have preferences, but they’re still cars, and they’re still going to allow you to drive places. And perhaps that’s what an organisation cares most about.
Even if you’re a senior data professional within your organisation, your choice may still be constrained by stack alignment (e.g. Microsoft 365 + Power Platform), or existing rollout commitments. You might get a say, but I would wager that it’s rare that you get a completely blank canvas.
So, while it’s fine to have a favourite, it’s not worth hanging your career or team harmony on it. Exercise pragmatism and be flexible.
Visual analytics isn’t about tools, it’s about fundamentals
Given the zeal on display, an outsider observing the debate around products like Tableau and Power BI might be convinced that the success or failure of any visual analytics solution hinges entirely on platform choice.
But that’s not even remotely true. Neither Tableau nor Power BI fundamentally changes messy data, poor visual communication, or weak analytical thinking. For every great dashboard, there are a thousand terrible ones built using these tools.
While many act as if the BI tool is the biggest variable in the success of an analytics project, it rarely is. The real drivers of analytical value are things like:
Establishing a shared understanding of the business problem
Building trust in your data
Designing visualisations that aid decision-making, not distract from it
Understanding your audience and designing for their needs
You can create stunning, effective dashboards in Excel. You can also produce unreadable monstrosities in the most expensive analytics platforms. The software is just one layer of the cake—often, one of the least important.
So what are the fundamentals I’m talking about? In visual analytics and dashboard design, they include Gestalt principles, the use of pre-attentive attributes to guide attention, and other concepts like colour theory, accessibility, chart-task fit, and cognitive load theory.
Instead of fixating on which tool does marginal things better, consider a wider lens:
How’s your data pipeline quality?
Will your stakeholders understand your dashboard?
Does the work you’re doing add value?
These matter far more than whether you can click-and-drag faster in Tableau or write DAX more elegantly in Power BI.
Less brand loyalty, more analytical maturity
Treat BI tools like vehicles. They’re a means to an end and shouldn’t be your identity. A mature data professional who works in the BI space should probably have good working knowledge of the major business intelligence tools anyway and be prepared to shift focus as required.
But obsessing over whether one tool is “better” just adds noise. Focus instead on building transferable skills, understanding context, and developing the ability to ship insights that actually help people make decisions in whatever tool you have available.
Because that’s the job of the data professional. The winner of the platform popularity contest is actually irrelevant.
Chart of the week
This line scatter plot from The Economist on the potential spread of measles in the US caught my eye.
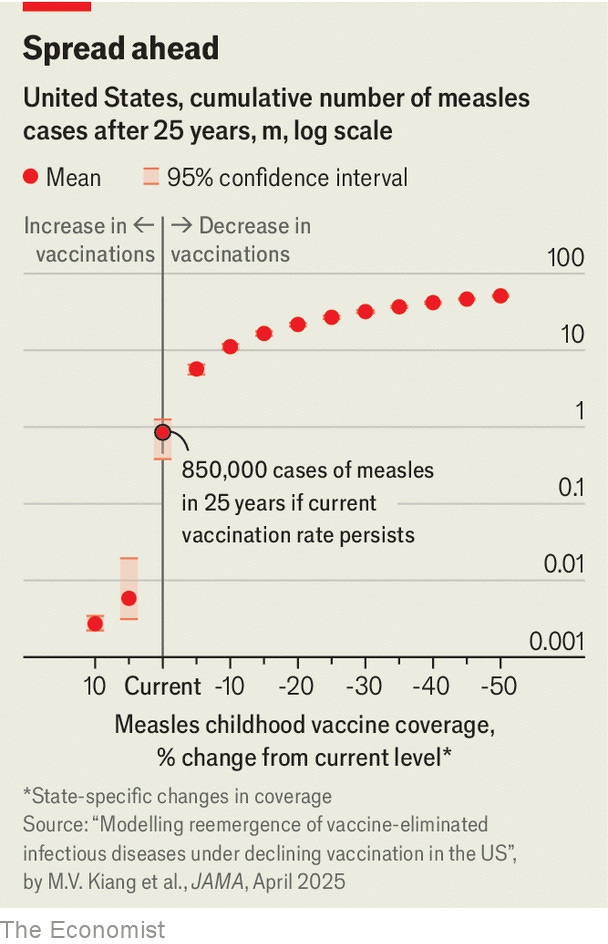
What I found quite interesting is the how the X axis decreases as you read left to right, which usually would be considered unusual. Curious, I asked the question on BlueSky as to why I was like that, and a kind soul by the name of Jesse Onland postulated that…

…which is actually a kind of cool little design choice and emphasises the pending crisis that is brewing in the US when it comes to the control of infectious diseases.
What I’ve been doing/watching/reading/listening
My family and I took a few days off to spend at one of my favourite holiday spots, Kingscliff on the north coast of New South Wales here in Australia.
I usually make it to Kingscliff a few times a years, often to race in the local triathlon, but often just to unwind and wander the stunning beaches. They took a bit of a beating during Tropical Cyclone Alfred back in March, but they’re still breathtakingly beautiful.
This time I was here to ‘race’ the Kingscliff Triathlon. A few friends came down to and it was a mega fun time, even if I did get sick and had to bail out mid way through the race. Ce la vie!
One of the best things about holidays is that always give me a bit more time to read, which can be hard during my busy day to day along with parenting. I’ve been head down in the great modern history of Saddam Hussein’s regime, The Achilles Trap by Steve Coll. Well worth a read if you’re into very modern history. This is a story well told.
Joe Reis had a great piece on the impact of AI on craft of software and data engineering, largely arguing something that I continue to believe in – that AI will continue to elevate the productivity of those who continue to strive to master their craft – not necessarily replace them.
Other reads:
Vincent Chen - LLMs are making me dumber
Jenna Jordan – Analytical data warehouses, an introduction.
Michael Scherer and Ashley Parker - The decline and fall of Elon Musk
Morgan Depenbusch - How to be interesting
Johnny Winter - Why do we dimensional model?
Joseph Fuller, Matt Sigelman and Michael Fenlon - How Gen AI could change the value of expertise
Finally, I’ve also managed to convince my partner that The Expanse is excellent science-fiction and that we should watch it together. She’s a big sci-fi nerd but had missed this one. While I had watched season 1 and 2, I am keen to finish it all, so have decided to rewatch from the beginning all the way through. We’re only a bit into the first season, but I still am really enjoy it!
And last bit of an already HUGE edition, I recently really loved The Rest is History’s recap of the early days of The Rolling Stones. And it’s sent me (once again) down a Rolling Stones rabbit hole, and wanted to share with you all my absolute favourite ‘Stones song, Tumbling Dice off their 1972 masterpiece ‘Exile on Mainstreet’.
Well, that’s the first edition of the rebooted version of The Datavist! I’d love to hear back on what you thought and your views on the above.
If you’re like to reach out via social media you can get me on LinkedIn and BlueSky.