


MCP and the reshaping of data visualisation & business intelligence
Model context protocol may have a huge impact on the domain of insight retrieval

I’ve resisted the urge to panic in the face of the artificial intelligence leviathan for quite some time.
For the most part, I’ve stuck to the view that large language models (LLMs) are productive tools. Useful enhancements that help good workers become even better. I’ve believed that people who specialise in building compelling visuals and communicating insights still have plenty of runway left in the labour market.
But my blissfully ignorant facade may have cracked this week after some deep reading on the emergence of model context protocol, or MCP, the apparent ‘USB-C of AI’.
Hold up, what is model context protocol?
For the uninitiated, MCP emerged in November 2024 from Anthropic (the folks behind Claude). It’s an open protocol that standardises how AI applications interact with external resources. That includes other applications, tools, contextual information and crucially, data. .
Here’s the basic idea: an AI application like Claude connects to an MCP server, which then pulls data from various integrated systems. Because MCP is an open, shared standard, you don’t need to build bespoke connectors for every service. One protocol to rule them all.
Hypothetically, those integrations could include anything — CSV files, Excel workbooks, Oracle databases, random PDFs. Even analytics tools like Power BI or Tableau could, in theory, be part of this ecosystem.
As Anthropic put it:
“MCP provides a universal, open standard for connecting AI systems with data sources, replacing fragmented integrations with a single protocol. The result is a simpler, more reliable way to give AI systems access to the data they need.”
Diagramming it out, the architecture might resembles the following:
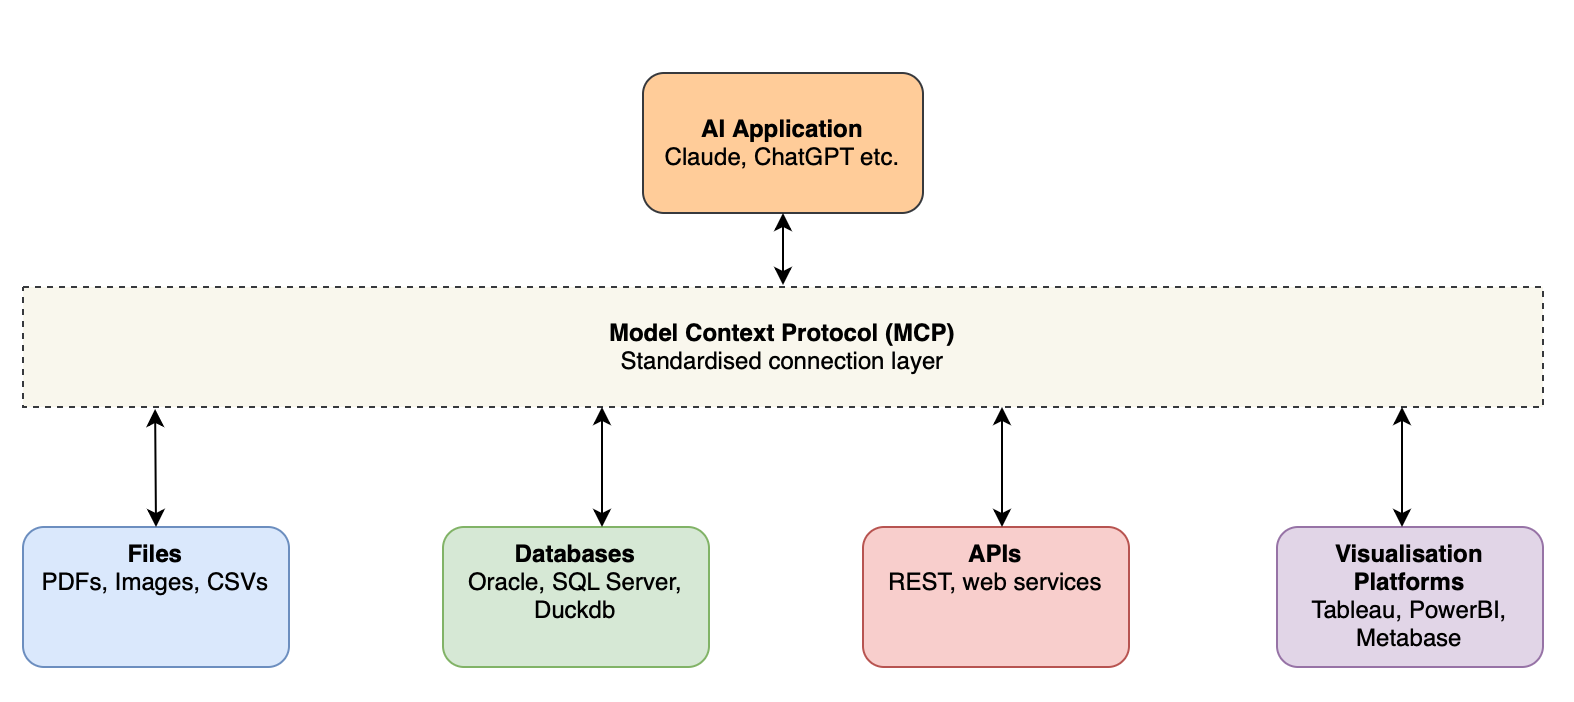
But the protocol doesn’t just limit itself to those items in the figure above, potentially any information could leverage MCP and provide extra useful context to AI applications.
Where things get interesting and a bit uncomfortable
I’m arguing that MCP opens up both an exciting and potentially unsettling landscape for traditional data visualisation and BI professionals.
If MCP makes it easy for AI systems to connect directly with your organisation’s data via a standard protocol, then the AI effectively becomes a powerful new interface for that data. And that has potential labour market consequences for typically highly paid data and insights folks.
Traditionally, the BI professional sits between data and decision-makers. We interpret requests, connect to the appropriate data sources, and build outputs that meet business needs. But with MCP in play, what if those same decision-makers can just... bypass us?
Picture this: your boss boots up Claude Desktop, connects it to your integrated data warehouse, and starts prompting it to create dashboards that answer business question. No pesky devs, no ticket queue, no intermediary.
That’s the potential shift. If AI can use MCP to access raw data and generate high-quality visuals and reports, what happens to the role of the BI developer?
So... should we panic?
Not quite yet.
I’m fully conscious of the AI-doomer angle of this post, but please indulge me and impart a few hopefully soothing words.
Right now, most data professionals still hold a clear competitive advantage when it comes to statistical literacy, data quality assessment, and the ability to translate complex findings into business-appropriate insights. These are not trivial skills, and I don’t think large language models have mastered them yet.
But that advantage may not last forever. As AI systems improve at statistical reasoning and contextual understanding, data professional will continuely need to adapt to stay valuable.
One obvious move? Start engaging with MCP now. Understand how it works. Experiment with MCP-enabled tools. Position yourself as the person who can design, manage and govern these new data interfaces, not just the chart grunt waiting to be replaced by them.
Skills in data engineering, data governance, and analytics infrastructure will still likely to grow in value. If you can ensure the data flowing through these new pipelines is clean, trustworthy, and well-managed, you’ll still be at the heart of the insight-delivery process.
BI professionals and data visualisation folk have the opportunity to shift gears here and widen their skill base to hedge against the risk of leaps forwards like MCP and continue to be relevant.
Visualisation experts still matter but the role may evolve
There’s another area where human BI professionals still hold a clear edge: data storytelling.
AI can generate charts. MCP might make it easier to do so.
But designing compelling visual metaphors, framing insights for specific audiences, and weaving data into narratives that inspire action, that’s still very much a human craft.
Knowing how to present sensitive results to senior executives, how to persuade stakeholders to adopt change, or how to design visuals that speak to a particular cultural or organisational context these skills remain uniquely ours. There likely will be demand for skilled data communicators to shape insights for our colleagues.
At least, for the time being.
What now?
At the time of writing, the big BI vendors don’t seem to be all-in on MCP — yet. There’s some activity around Metabase integration, but little from Tableau or Microsoft (Power BI). That might change.
In fact, I suspect it’s only a matter of time. But, in the meantime, I would love to hear your thoughts!
********
I basically stumbled across the concept of MCP thanks to some of the great recent LinkedIn posts by Brian Julius, and this post is partially inspired by his recent posts.
He’s published a few recent short videos explaining the concept that are worth a watch.
Chart of the week
I worked in international education as an analyst for nearly a decade (leaving in around 2021), and while I met a lot of great folks (whom I’m still friends with today), I have no regrets about leaving the sector. International education - particularly in Australia - seems to live in a perpetual roller coaster, caught between a public that largely dislikes the sector and government who pays it lip service.
Anyway, this chart (again from The Economist) caught my eye, showing the significant decline in webpage views for university courses in the United States in 2025.
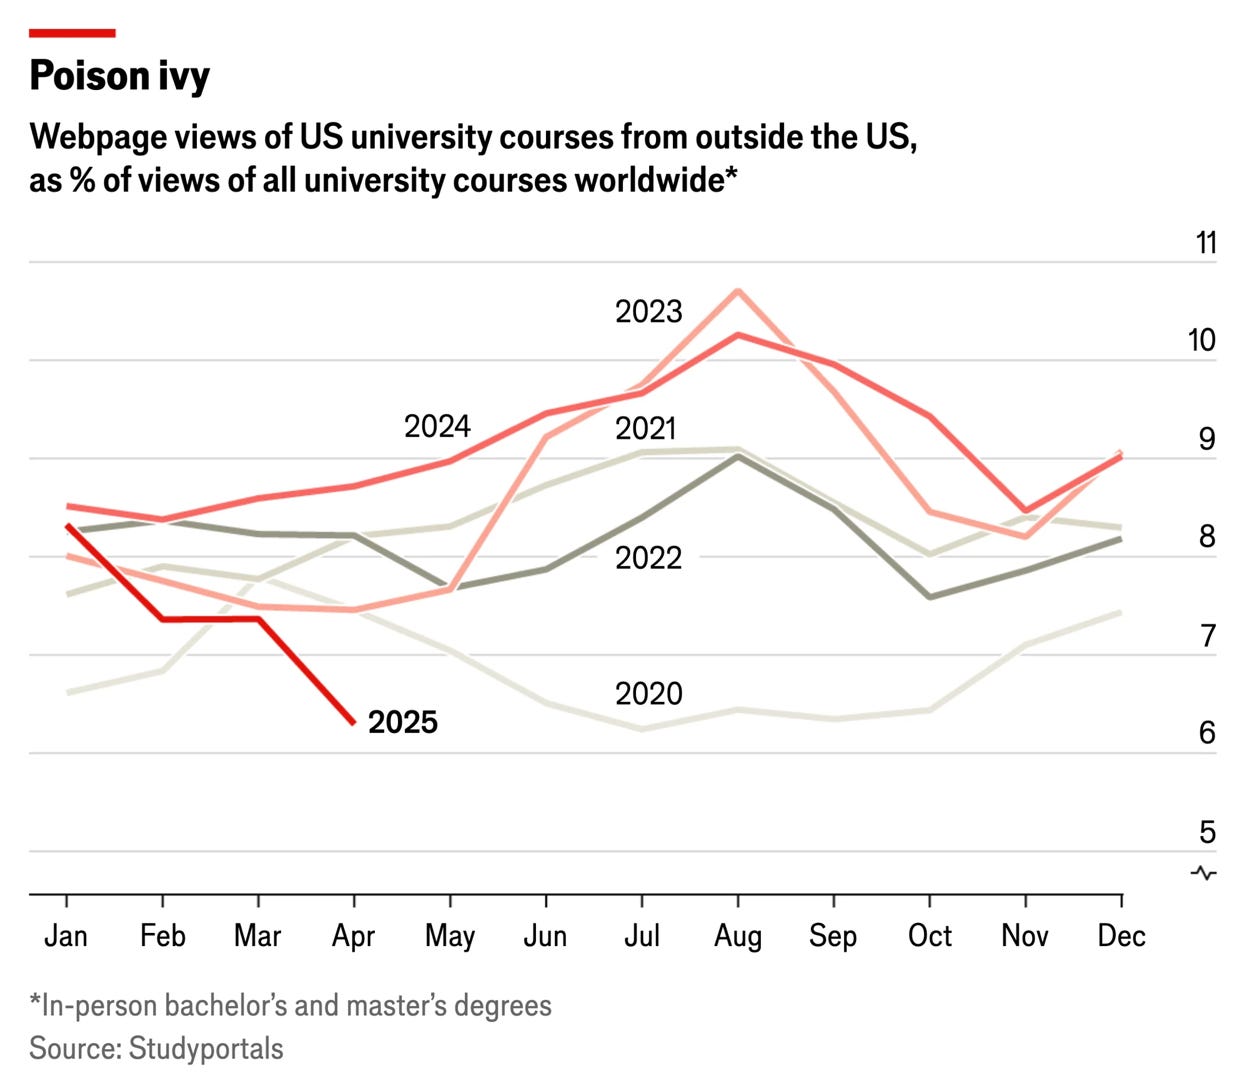
It doesn’t take a genius to figure out why this might be the case. But again, I wanted to acknowledge the cleanness of the chart and the clear insight it presents, using a gray-to-red colour palette to indicate recency.
What I’ve been doing/watching/reading/listening
I’ve actually been quite ill the last week. Nothing serious or anything, but some kind of insane cold that has kept me under the weather.
As a result, I’ve basically not doing anything of note - except continuing to watch The Expanse! Which is still amazing. I’m now midway through season 3, and it’s only getting better. In fact, I’m prepared to say its the best science fiction series I’ve ever watched.
Changing gears, I was once what you might call a Tool-obsessive, spending a lot of the money I earned in my early 20s on records, merch and random collector items. I've probably moved on from those days (I don’t really like the newer Tool stuff), but it was fun to discuss the band in the Practical Data Modelling discord this week.
Specifically, I remember this cool video done back in the day (hence the poor quality) isolating Danny Carey’s incredible drumming on the title-track to their third full-length record, Lateralus. As someone who dabbled in drumming for a few years, I still cannot comprehend what he is doing here. What a phenom.
In terms of reading, I liked this post from Kurt Buhler called “Power BI for beginners: 7 mistakes you don’t want to make” which details a few helpful tips and tricks for Power BI folks - at all levels of ability (beginners through to advanced).
Here’s a few other articles I enjoyed reading:
Madison Mae - Data Model too course? What is grain and why it’s everything in data modelling
Simon Willison - How often to LLMs snitch? Recreating Theo’s SnitchBench with LLM
Seattle Data Guy.- How to keep your data team from becoming a money pit
Pipeline to Insights - Implementing data quality framework with dbt
That’s it for this round of The Datavist. As usual, would love to hear from you. You’re welcome to comment here, or reach out via LinkedIn or BlueSky.
Of course, you’re also welcome to subscribe for free (below)!. Till next time.
Appreciate the clear-eyed perspective here - I think this is a sensible balance of "what is actually happening *right now*" and "what is likely to happen surprisingly soon". All too easy to focus on one and dismiss the other!