
Colour as Strategy and Aesthetics: What the Bureau of Meteorology’s Radar Teaches About Data Visualisation
An ill-fated radar redesign reminds us that colour decisions are never cosmetic, they define how data is read and believed.

When the Australian Bureau of Meteorology back-tracked on its new rain radar colours, it was not bowing to public pressure. It was acknowledging a design truth. The use of colour in data visualisation is both a strategic and aesthetic choice. Those who master it do not use colour to decorate; they use it to communicate.
In late 2025 the Australian Bureau of Meteorology found itself facing an unusually fierce wave of public criticism. The Bureau, a national institution responsible for weather forecasting and hazard warnings, had launched a major website overhaul intended to modernise its digital infrastructure. At the centre of the update was a redesigned rain radar, the country’s most heavily used public data product. It attracts close to two million visits each day and many millions more during severe weather. For Australians, checking the radar is a daily ritual as ordinary as glancing at the clock.
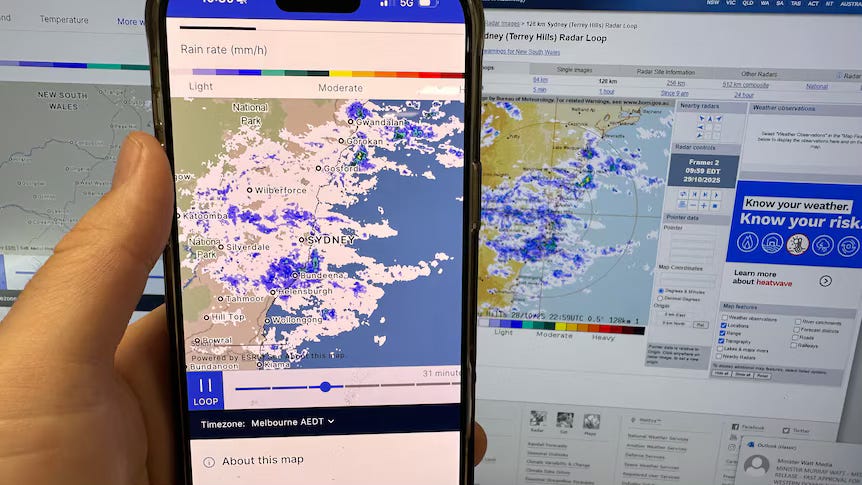
The new site was allegedly faster and technically sound, but one detail changed everything. The default radar view shifted from displaying rain reflectivity, a measure of how strongly radar signals bounce off precipitation, to showing rain rate, or millimetres per hour. That adjustment was subtle in technical terms but transformative in practice. It altered the scale, the colour mapping, and the way intensity appeared on screen.
For decades Australians had become fluent in reading the old reflectivity scale: light showers appeared in shades of blue, heavier rain moved through greens and yellows, and the most intense cells (those capable of producing hail) showed as deep red or black.
That visual language was so deeply embedded that many could interpret conditions immediately. The new mode, paired with a softer, smoother palette, seemed to compress those extremes. Downpours that once looked severe now appeared moderate. To many users the radar seemed to understate intensity, eroding the intuitive trust built through years of habitual use.
The result was immediate confusion. Farmers, pilots and commuters reported that they could no longer read the radar instinctively. Years of perceptual training had been revoked overnight. The dark reds and blacks that once conveyed danger now meant something else entirely, and nobody seemed quite sure what. The Bureau argued that the new colours were more scientifically accurate, yet accuracy was not the problem. Comprehension was. Within days of widespread complaints, the Bureau restored the original palette.
Colour as strategy and aesthetic
This episode demonstrated a principle that extends well beyond meteorology. Colour in data visualisation is not decorative, but neither is it purely functional. It operates in both domains.
A well-considered palette fulfils two simultaneous goals. It communicates structure and hierarchy, the strategic function, while also shaping the viewer’s emotional and perceptual experience, the aesthetic one. When those two dimensions are aligned, visualisations feel natural and effortless to read. When they diverge, even accurate data can feel wrong.
When the Bureau altered its palette, it disrupted both the aesthetic familiarity and the strategic clarity of the radar. The new design may have satisfied internal standards of polish, but it weakened the interpretive bond between colour and meaning. The radar stopped being a visual instrument for rapid comprehension and became a static picture that demanded conscious decoding.
Restraint as a mark of mastery
Indulge me for a second, as I use this timely event on colour to climb aboard a soapbox.
I often said that one useful way to distinguish a novice from an experienced visual designer is to observe their treatment of colour. The novice uses it to attract attention; the expert uses it to direct attention.
Beginners often treat colour as a way to create visual interest, reaching instinctively for variety and contrast. Advanced practitioners treat it as a scarce resource. They choose fewer colours, apply them with intent, and understand that aesthetic harmony and communicative clarity depend on restraint.
The Bureau’s earlier palette succeeded because it was both visually coherent and semantically stable. The attempt to modernise it reflected a common misunderstanding that aesthetic refinement and strategic effectiveness are mutually exclusive. In truth, the most elegant visualisations are those where the aesthetic supports the strategic, where beauty and comprehension are part of the same design decision.
Beyond surface design
The Bureau’s reversal revealed how apparently superficial choices can have real institutional consequences. A national weather agency can withstand criticism for a missed forecast, but it risks credibility when users say they can no longer read the map. Trust in data is inseparable from trust in its presentation.
The same holds true in analytical work more broadly. A shift from red to amber for a risk indicator, or from green to blue for project status, may seem stylistic. In reality it changes how people interpret identical information. Colour decisions that appear aesthetic are often strategic at their core. Used without purpose, colour distracts. Used deliberately, it guides attention and reinforces understanding.
Closing reflection
Sophistication in data work is often measured by technical capability: complex models, automated pipelines or interactive dashboards. Yet mastery in visualisation is revealed through disciplined control of the fundamentals, and none requires more judgement than colour.
The best practitioners understand that a palette is both an aesthetic system and a strategic framework. They choose colours that are visually balanced, cognitively efficient and culturally familiar. They apply them consistently and know when restraint is the more intelligent choice.
The Bureau of Meteorology’s radar controversy serves as a quiet reminder. Progress in visualisation is not always achieved through novelty or redesign. Sometimes it lies in aligning strategy with aesthetics, and in using colour with intent.
Some great links on colour in data visualisation!
Lisa Charlotte Muth - A Detailed Guide to Colors in Data Vis Style Guides
Mike Cisneros - Use Color to Focus or to Compete for Attention.
If you made it this far, thanks so much for reading! Feel free to leave a comment if you’ve got any reflections of your own.